Home How it works Pricing FAQ Roadmap
Sign in Register your interest →
✦ Full feature breakdown

Everything inside
SteamStack.

A complete look at every module — what it does, how it works, and what it looks like in your hands.

Know how the business is
actually going. Weekly.

Not a quarterly surprise from your accountant — a real profit and loss you can read on a Monday, with every number traceable back to the invoice or shift behind it.

Weekly
Break-even P&L, accrual and ex-GST
6 months
Side by side on one screen
Per line
Click any figure to see its source
BAS
GST, PAYGW and super in one panel
Business Insights
Weekly Reports

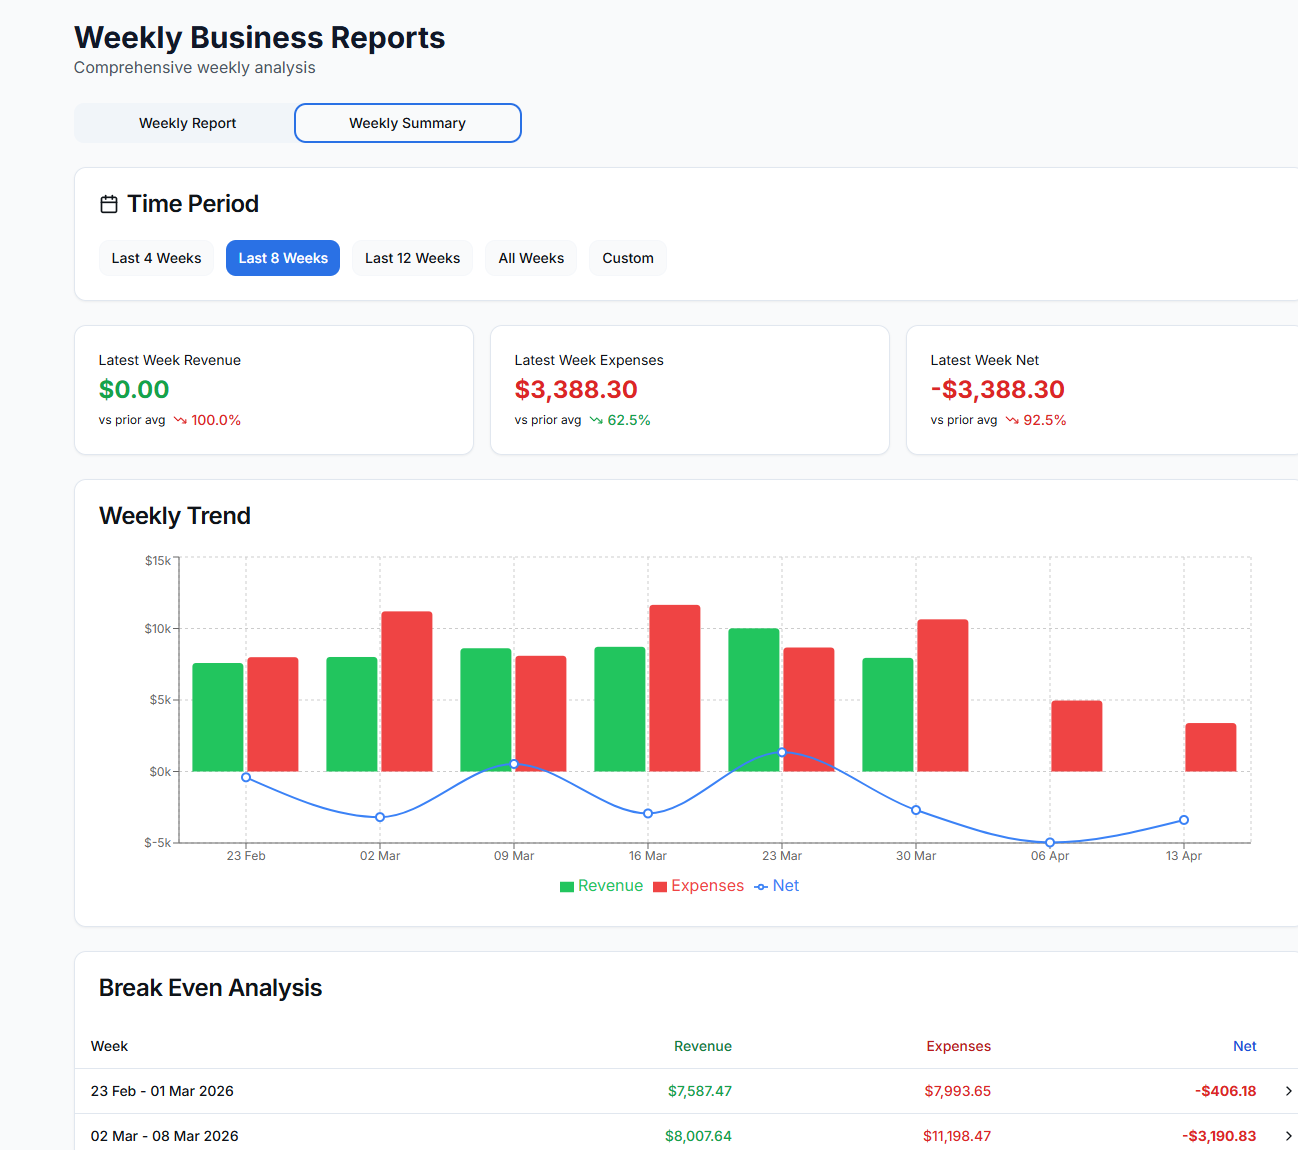
An accrual, ex-GST weekly profit and loss that matches the sales you earned this week against the costs you ran up this week. It answers “did I make money this week?” rather than “did my bank balance move?” — with your break-even sitting right beside it.

Break-even target shown against actual revenue
Four ways to calculate cost of goods — ordered, paid, estimated, or actual from recipes
Fixed overheads pro-rated day by day, so a mid-week rent change stays accurate
BAS panel: GST collected, input credits, net GST payable
PAYGW withheld and superannuation owing
Click any line to see the invoices and shifts behind it
Weekly business report with break-even target
Business Insights
Executive Dashboard

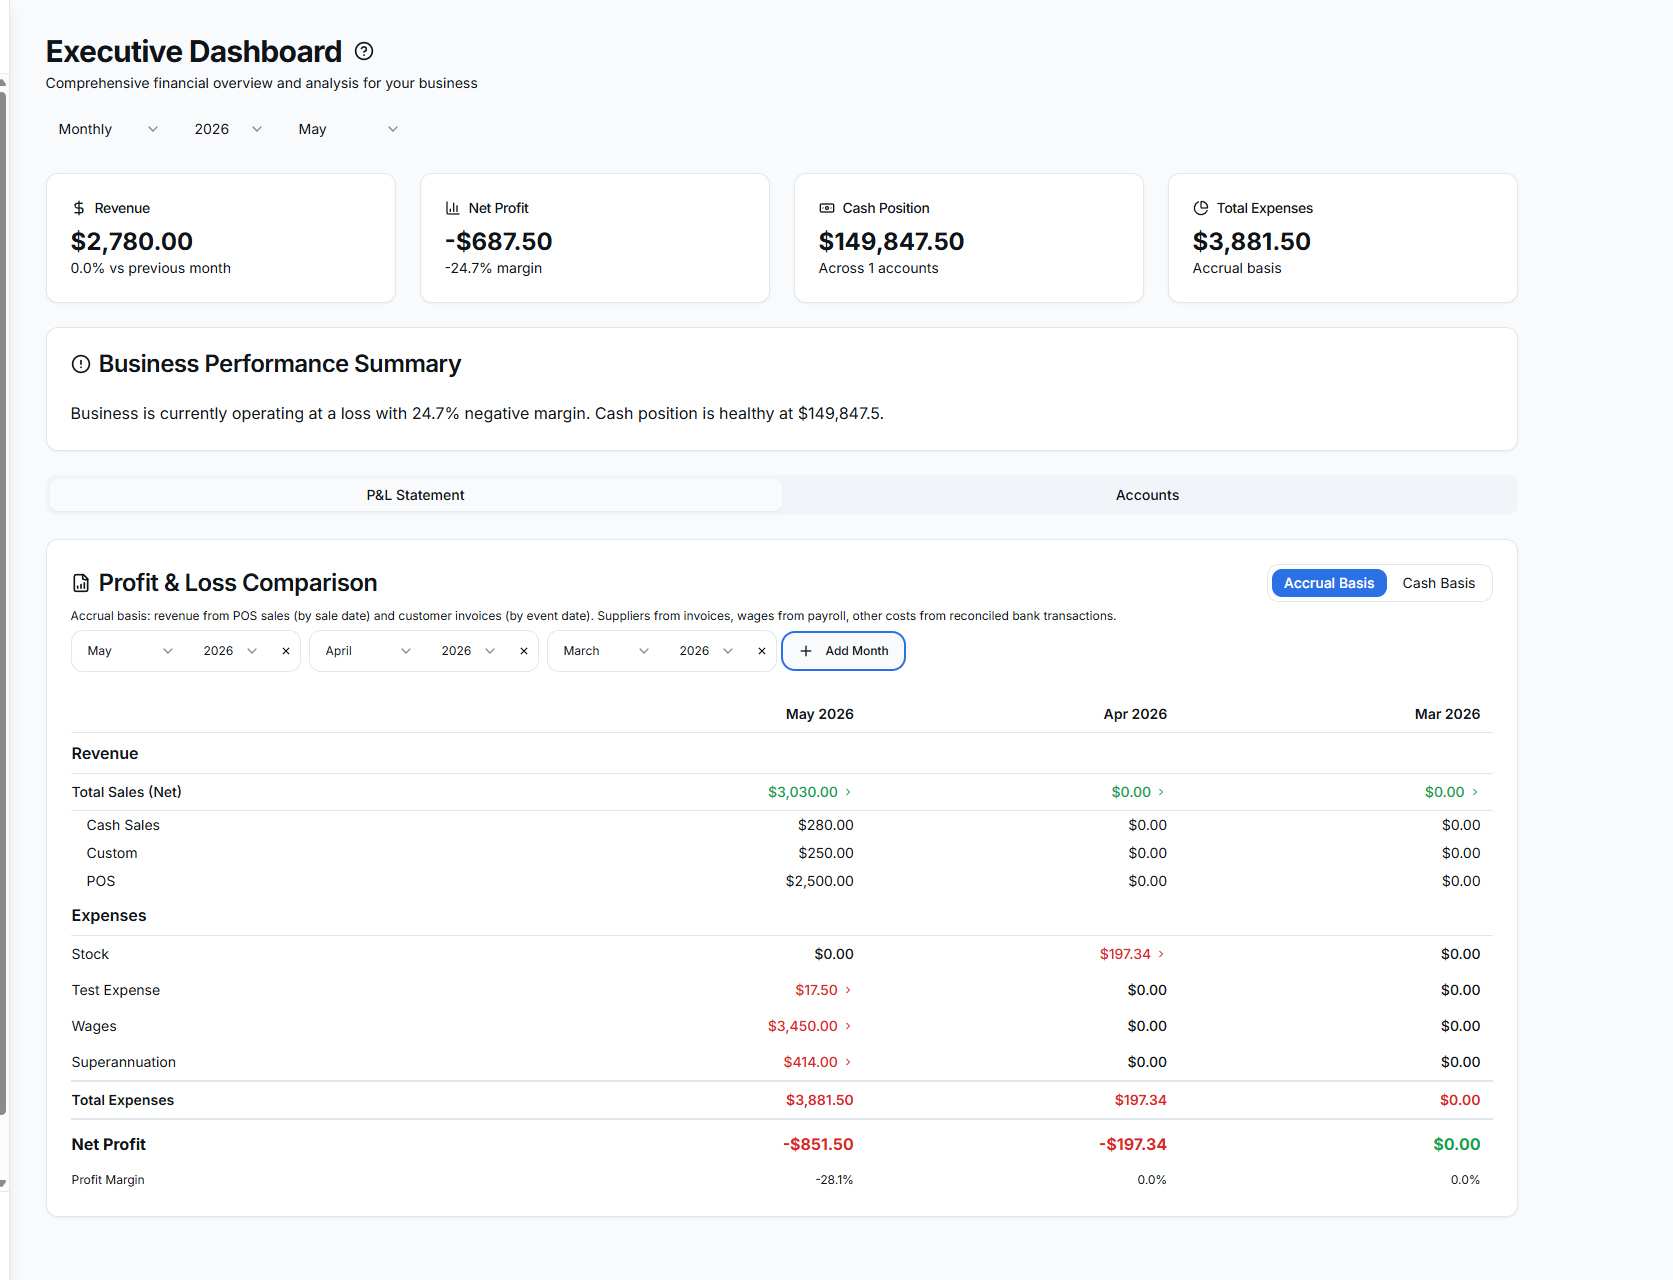
A financial snapshot — revenue, profit, expenses and cash position — with a cash-basis or accrual-basis toggle, and up to six months lined up side by side so you can see the shape of the year.

Revenue, expenses, net profit and margin
Accrual or cash basis, toggled in one click
Compare up to six months as columns
Click any P&L line to drill into the transactions
Total cash position across every account
Wages, super and PAYGW broken out
Executive dashboard with monthly profit and loss
Business Insights
Business Summary

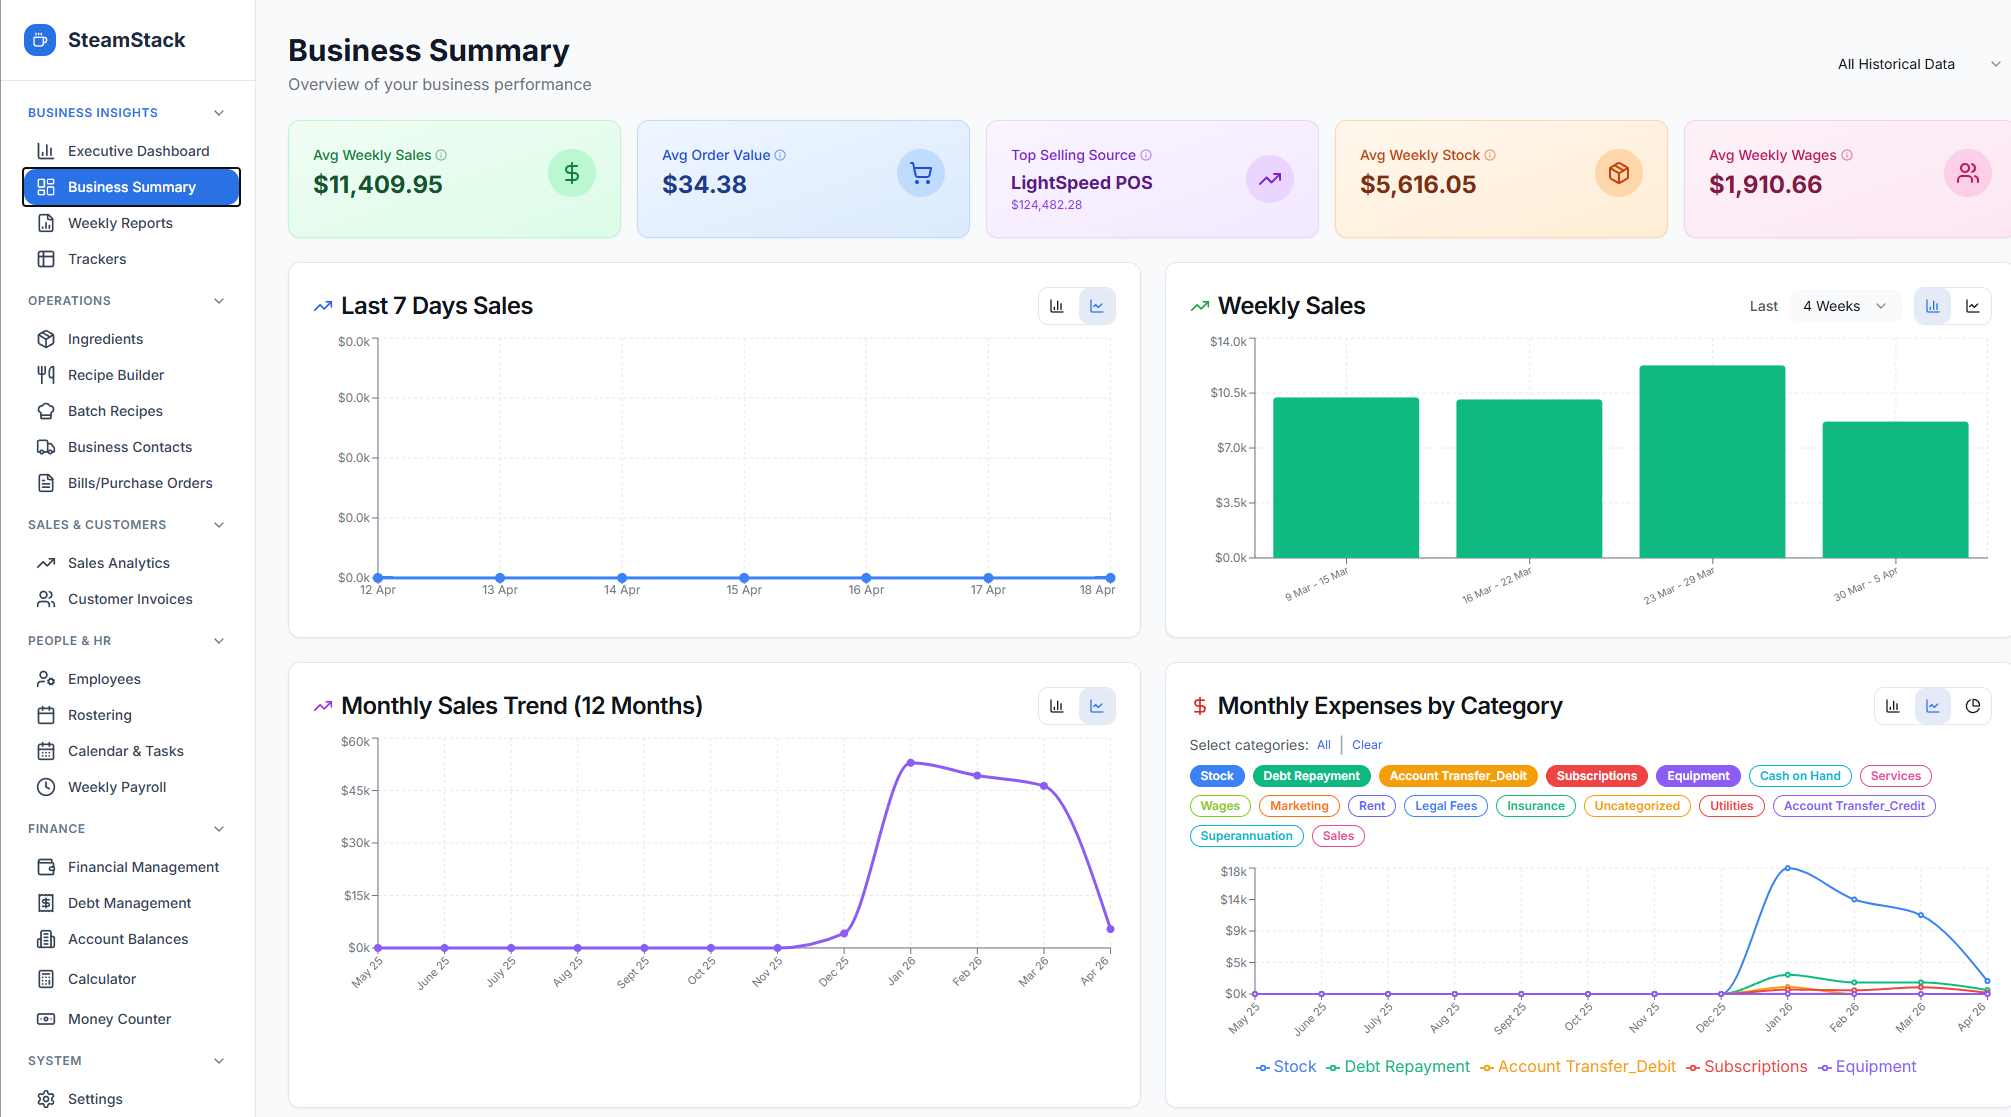
The page you land on. Five headline numbers and the charts behind them — and every KPI opens up to show exactly which records produced it, so you are never looking at a figure you cannot explain.

Average weekly sales and average order value
Top selling source across POS and delivery
Average weekly wages and stock cost
Every KPI opens a full calculation breakdown
Alerts for unpaid supplier and overdue customer invoices
Compare expense categories on one chart
Business summary with weekly KPIs and charts
Business Insights
Trackers

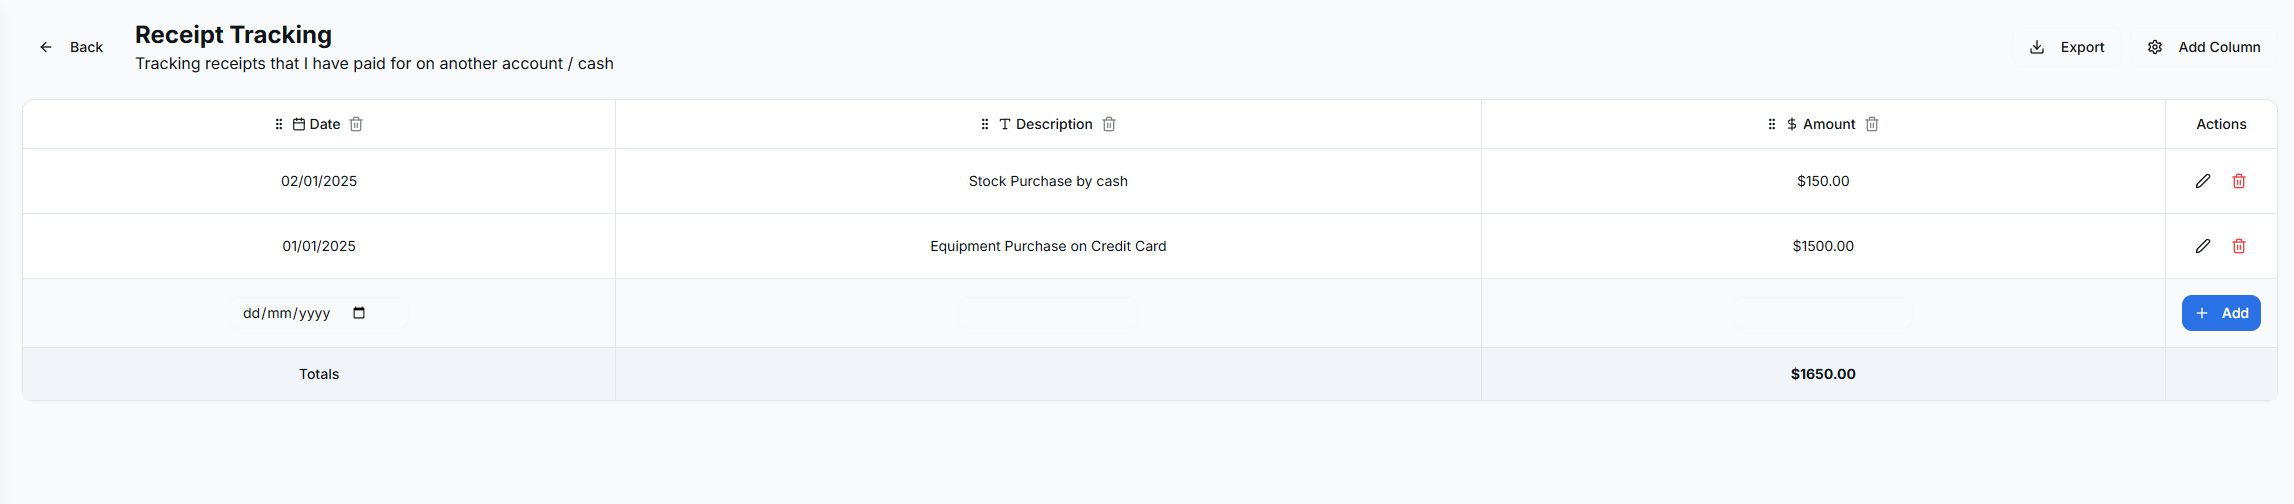
Custom spreadsheets you build yourself, for the things every venue does differently — cash drops, equipment checks, cleaning schedules. Anything SteamStack doesn’t model directly.

Columns typed as text, number, currency, date, yes/no or dropdown
Drag to reorder columns, click to sort
Per-column totals
Export to PDF or CSV
As many trackers as you need
Custom tracker for daily cash drops

Photograph an invoice.
It fills itself in.

The paperwork side of a café, minus the paperwork. Supplier bills read themselves, ingredient prices flow into your recipes, and your true food cost keeps itself current.

Read for you
Invoices from a PDF or a photo
Every supplier
The same item, priced and ranked
Per dish
Ingredients, labour and wastage
Cascading
Batch costs flow into finished plates
Operations
Bills & Purchase Orders

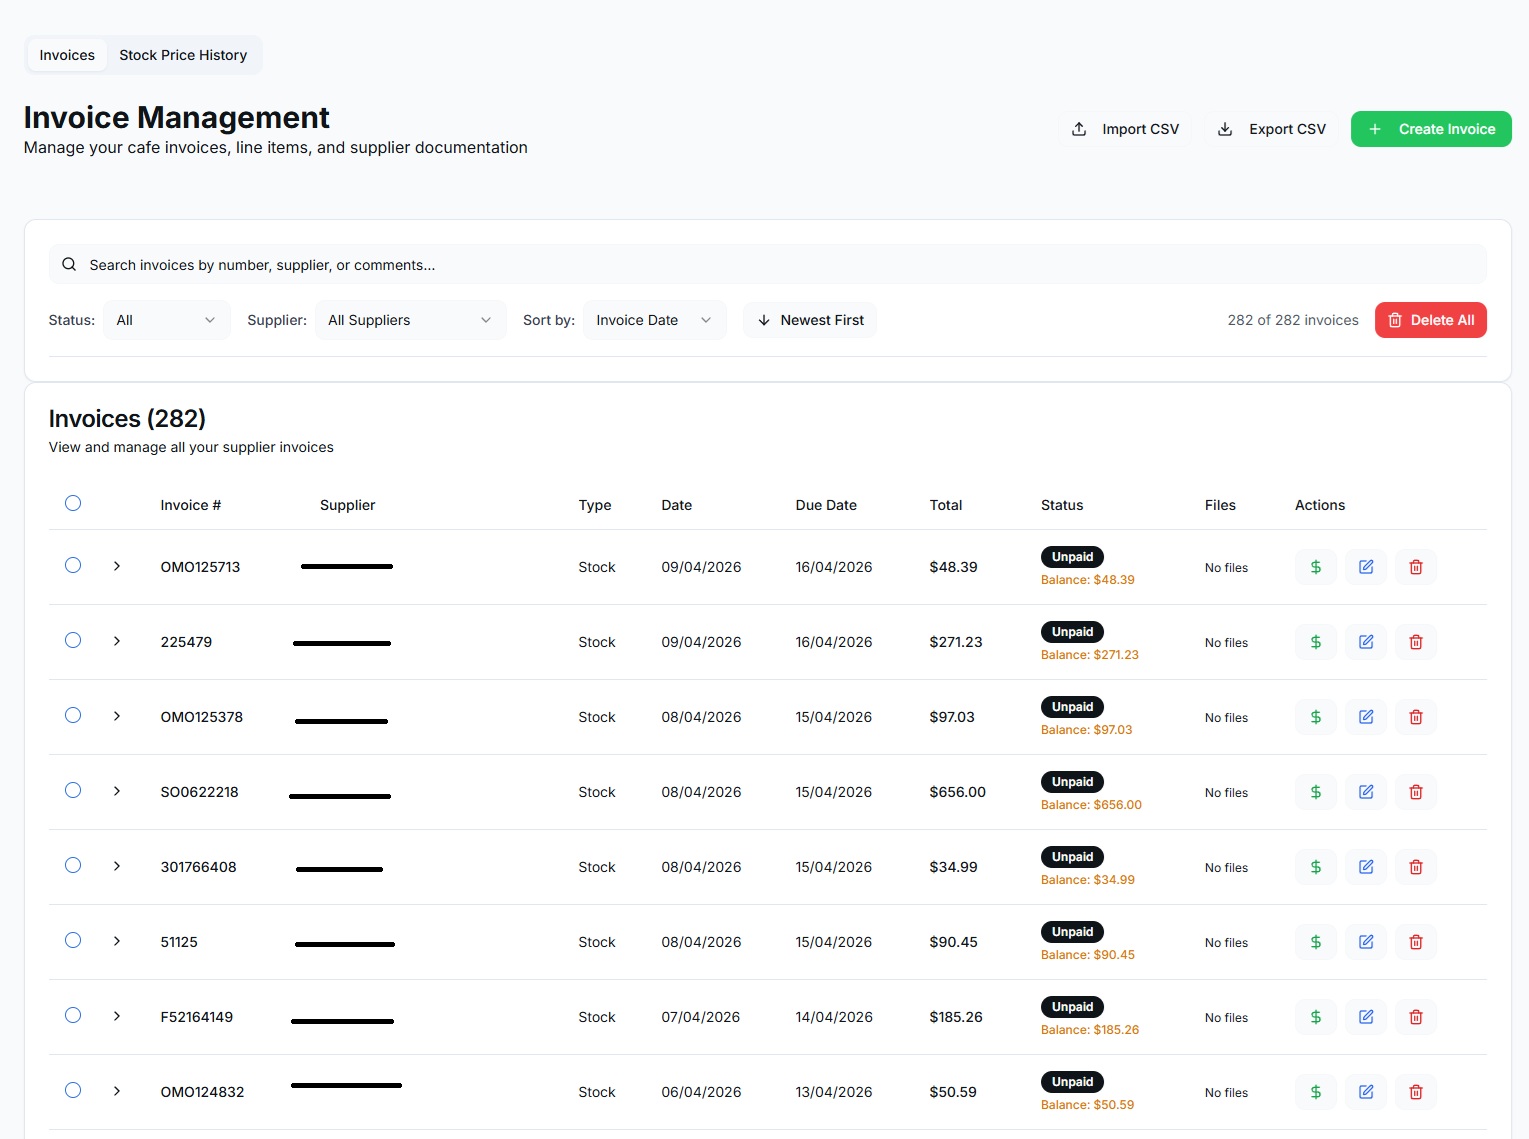
Upload a supplier invoice as a PDF or a photo and SteamStack reads it — supplier, invoice number, dates, totals, GST, and every line item with its quantity and unit price. You check what it found and confirm. No typing invoices in at 9pm.

Reads PDFs and photos, then shows you what it found before saving
Line items with GST calculated per line
Maps invoice lines to your ingredients, and remembers the mapping next time
Full or partial payments, matched to bank transactions
The original file stays attached to the invoice
Stock price history and a price-over-time chart per item
Supplier invoices with status and balances
Operations
Ingredients

The master list of everything you buy, with cost per unit, supplier, category and unit of measure. This is the foundation every recipe cost is built on, and it updates itself as new invoices come in.

Cost per unit kept current from supplier invoices
Bulk pricing converted to a per-unit cost
Search and filter by category or supplier
Merge duplicate items that arrived under different names
Price history charted per ingredient
Bulk import from CSV
Ingredient list with supplier pricing
Operations
Price Comparison

The same ingredient, priced across every supplier and brand you buy from, normalised to a common unit so the comparison is honest. Cheapest is flagged, the saving is shown in dollars, and the biggest wins sort to the top.

Prices normalised to a base unit — $/kg, $/L — so pack sizes don’t hide the difference
Pack contents bridge count-priced and weight-priced offers
Cheapest, next cheapest and most expensive side by side
Potential saving per unit, and the percentage
Sorted by biggest saving first
Filter by category to review one part of the menu at a time
The same ingredient priced across every supplier
Operations
Recipe Builder

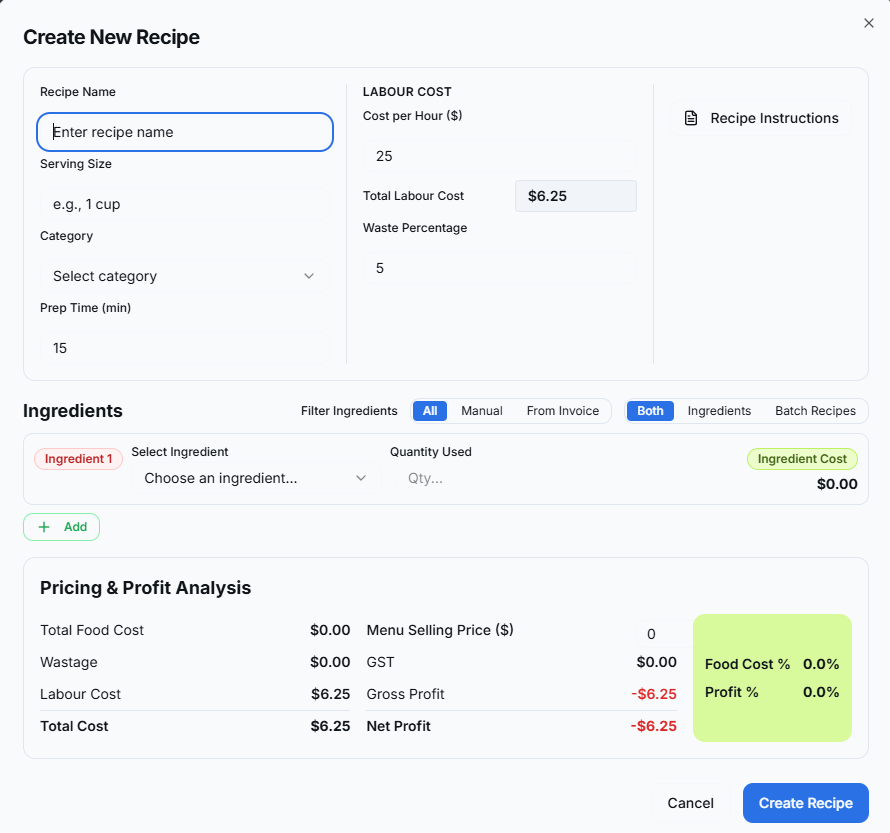
What a menu item actually costs you — ingredients plus labour plus wastage, not just the ingredients. Change a supplier price and every recipe using it updates, so your margins stay honest.

Food cost, labour cost and total cost per serve
Live food cost percentage and gross profit
Wastage built into the calculation
“Refresh all costs” re-prices every recipe at once
Export costed recipes, or printable cards for the kitchen
In-app explainer showing how each number is derived
Recipe builder with live food cost percentage
Operations
Batch Recipes

Sub-recipes you make in bulk — sauces, doughs, dressings — with a yield and a unit. SteamStack works out the per-unit cost of the batch, and you drop it into a finished dish like any other ingredient.

Per-unit cost calculated from batch yield
Use a batch inside a finished recipe
Price changes cascade: ingredient to batch to dish
Labour and prep time included
Export to PDF
Batch recipes with per-unit cost
Operations
Business Contacts

Your supplier address book. Adding a supplier here lets invoices, ingredients and payments all point back to one record — and sets a default expense category so new bills categorise themselves.

Contact, email, phone, address and ABN
Payment terms per supplier
Default expense category so bills self-categorise
Drill in to see that supplier’s ingredients and recent invoices
Supplier contact records

What's actually selling,
and what it really costs.

Import your POS and delivery data, then map products to recipes so your weekly P&L can work out real cost of goods instead of an estimate.

3 platforms
Lightspeed, Uber Eats, HungryHungry
Per product
Units sold, per day
Actual COGS
Units sold × real recipe cost
Rollback
Undo any import
Sales & Customers
Sales Analytics

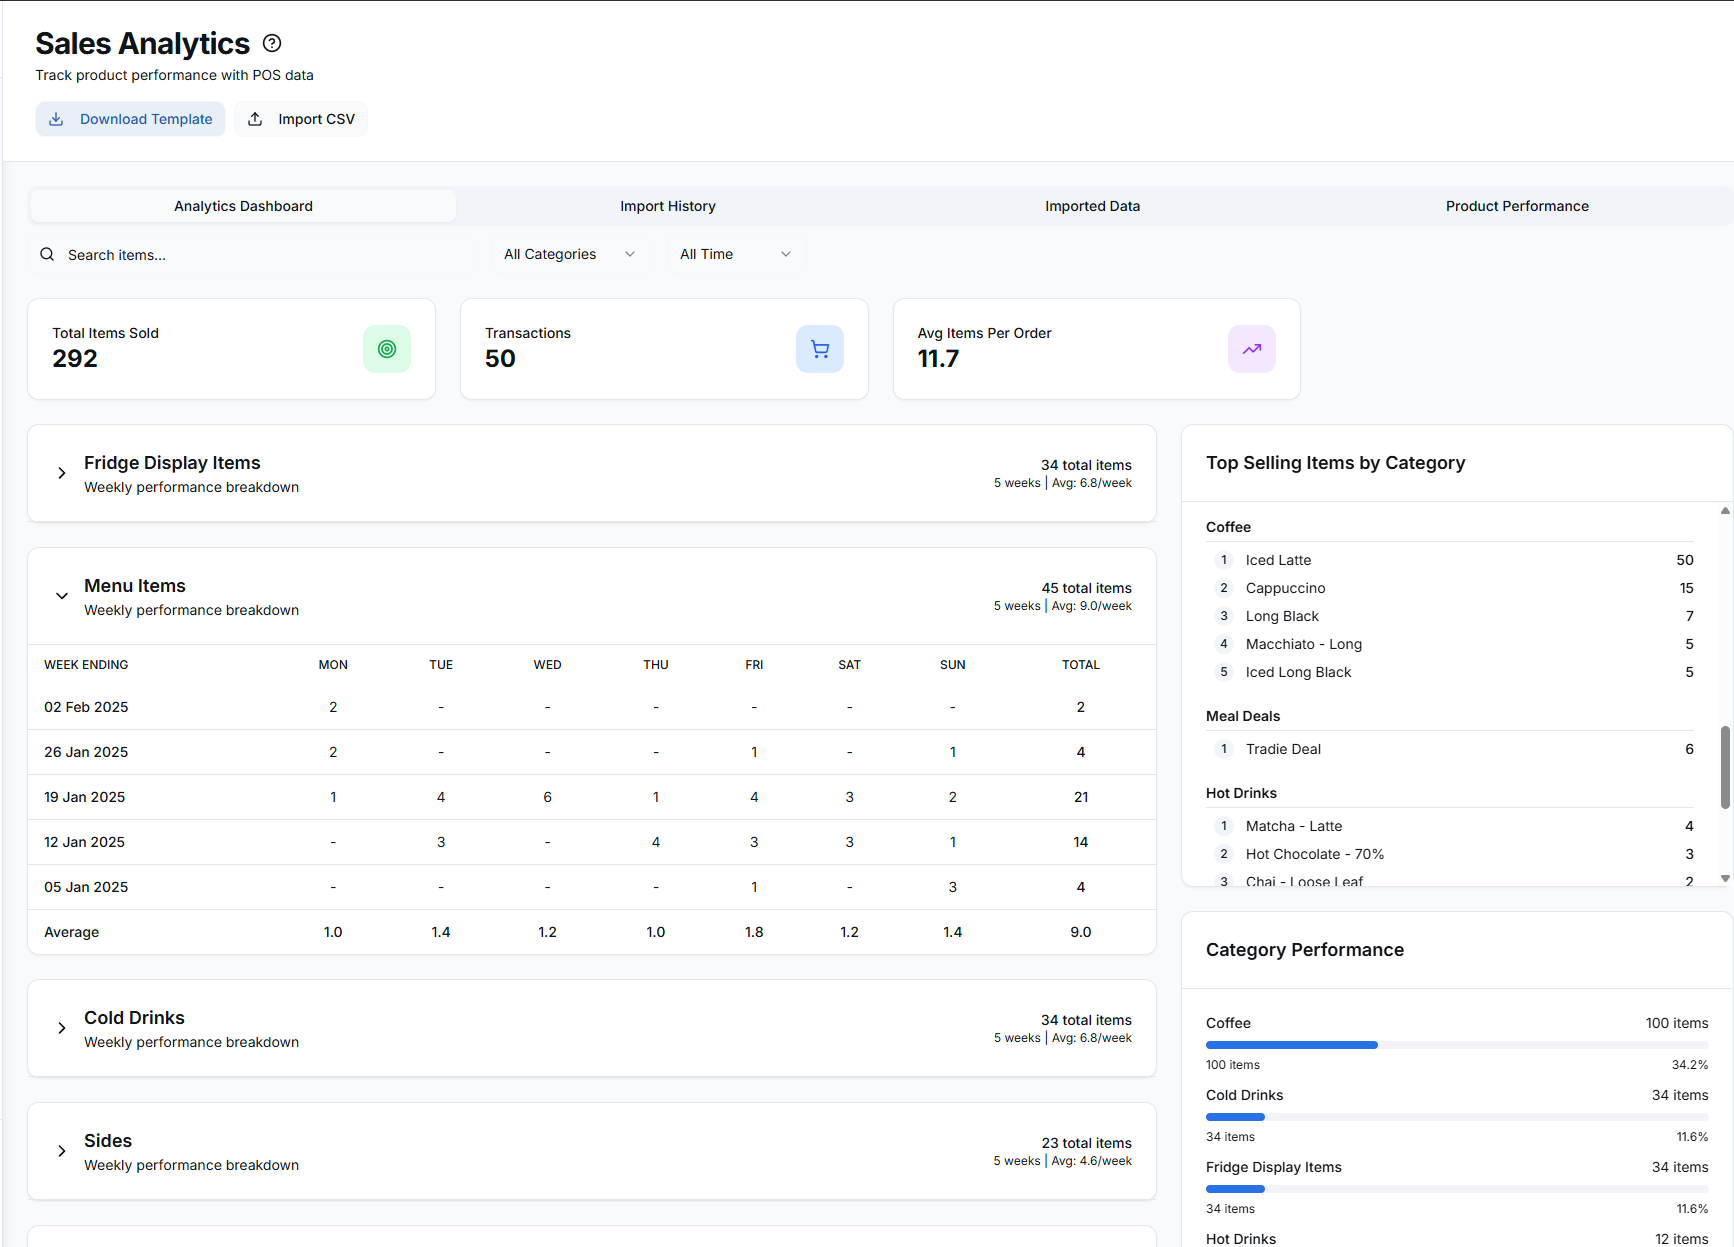
Daily sales from Lightspeed, Uber Eats and HungryHungry — or any CSV. The format is matched for you and previewed before anything commits, and re-importing a day safely replaces it rather than doubling it up.

Lightspeed, Uber Eats and HungryHungry formats recognised
Preview before commit, with duplicate and error flags per row
Units sold per product, per day, by reporting group
Gross versus net sales, order counts, top channels
Import history with full rollback
Map products to recipes so the P&L can use actual cost of goods
Sales analytics by category and channel
Sales & Customers
Customer Invoices

Bills you send out, for wholesale accounts and catering jobs. They feed the accrual P&L and show as outstanding receivables until they’re paid, so nothing quietly goes uncollected.

Customer records with contact details
Invoice, due and event dates
Line items with GST
Full or partial payments matched to bank transactions
Overdue receivables surface as alerts on your home screen
Customer invoicing for wholesale and catering

Build the roster.
Watch the wage bill move.

Labour cost updates as you drag shifts around, and the pay run that follows calculates tax the way the ATO calculates it.

Live
Labour cost % as you build
ATO tables
PAYG from the official coefficients
Pay hidden
Staff roster PDF redacts wages
7 years
Fair Work record retention
People & HR
Rostering

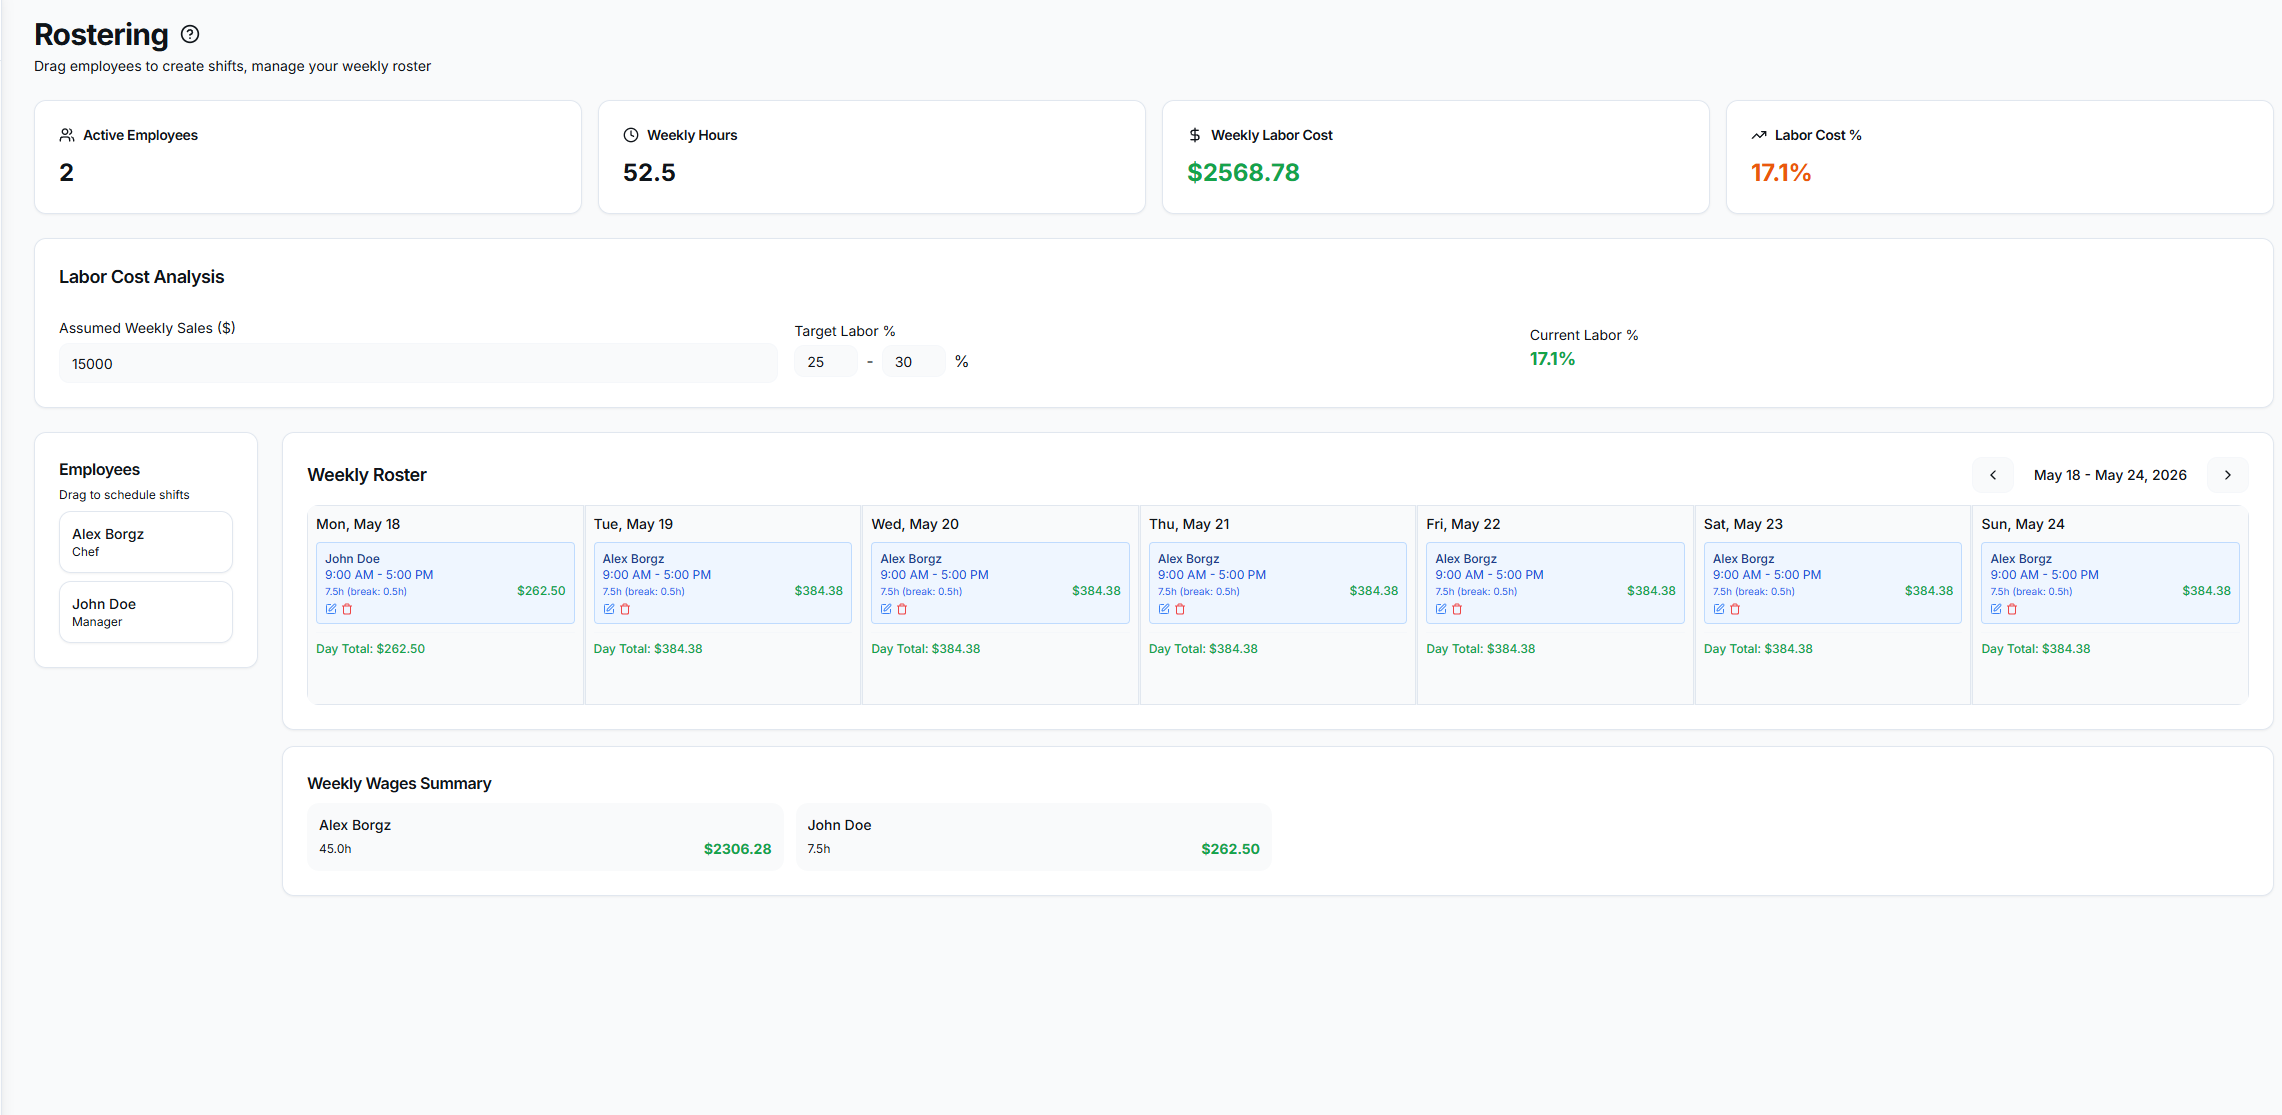
Build the week by dragging shifts onto a grid. Weekly hours, labour cost and labour percentage update as you go, measured against your target — so you find out you’ve over-rostered on Tuesday, not on payday.

Drag to move, drag the edges to resize a shift
Live weekly labour cost and labour cost percentage against target
Daily totals across the week
Handles salaried and hourly staff differently
Export a staff PDF with pay information hidden by default
Send the finished week straight through to payroll
Weekly roster with live labour cost
People & HR
Weekly Payroll

Turns hours into pay. PAYG withholding comes from the official ATO coefficient tables, keyed by financial year and tax scale — so a pay run that straddles 30 June uses the right year’s figures without you thinking about it.

Quick entry or day-by-day timesheet mode
Draft a whole week from the published roster
PAYG withholding from official ATO tables (NAT 1004 / NAT 3539)
Study and training loan repayments handled automatically
Leave, reimbursements, pre-tax and post-tax deductions
Finalising a week accrues super and PAYGW into Debt Management
Back-pay calculator for backdated rate rises
Per-week lock so a finalised run can’t be quietly rewritten
Weekly payroll with tax and superannuation
People & HR
Employees

Each staff member’s details — position, pay basis, superannuation, tax setup — feeding both the roster’s cost estimates and the actual pay run.

Hourly or salaried, with multiple earning rates per person
Tax-free threshold and study loan flags
Leave types with their own rates, including unpaid
Recurring pre-tax and post-tax deductions
Date-effective rate history, so old pay runs keep the rate actually paid
Offboarding preserves pay records for the seven years Fair Work requires
Employee records with pay rates
People & HR
Calendar & Tasks

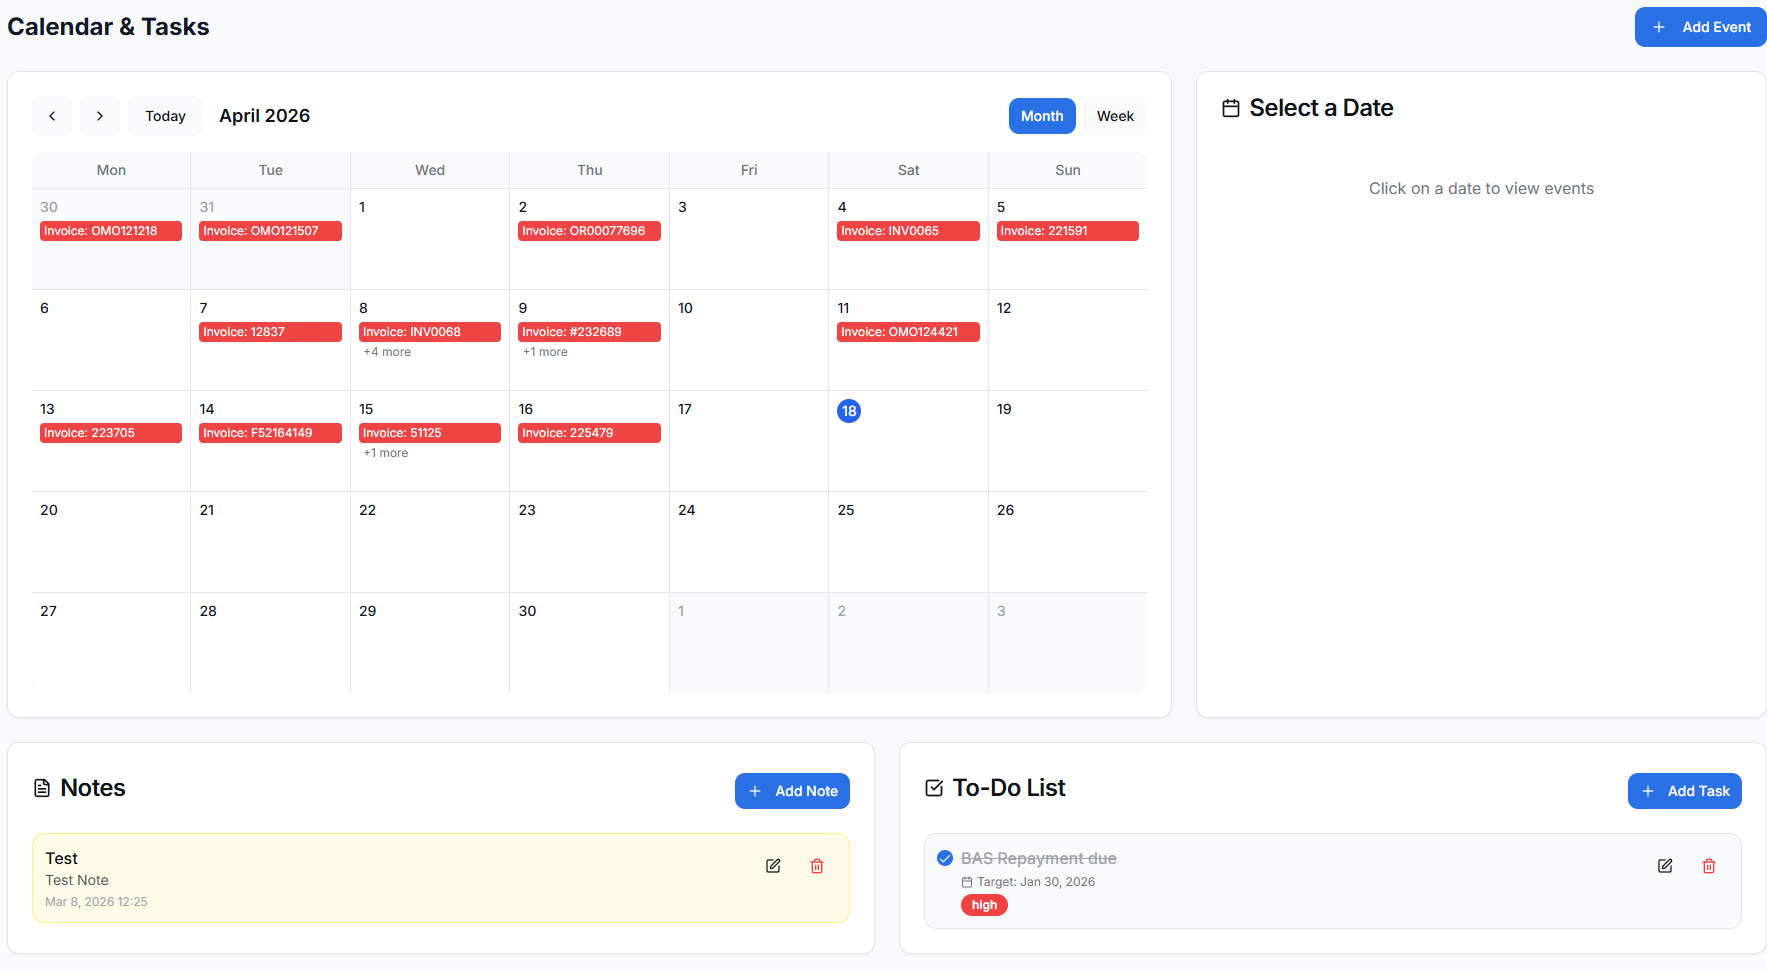
Somewhere to put the things that aren’t a shift — BAS due, supplier price review, staff training, equipment service. With a to-do list that goes red when something is overdue.

All-day or timed events with descriptions
To-dos with priority and target dates
Overdue items flagged in red
Free-form notes alongside
Calendar, tasks and notes

Match the bank.
Know what you owe.

Import your statement and tell SteamStack what each line actually paid for. Change a rent amount and your historical reports stay correct.

Matched
Bank lines to invoices and debts
Partial
Short payments handled properly
Dated
Expense changes keep their history
Live
Balances from reconciled data
Finance
Financial Management

Import your bank CSV and match each transaction to the thing it actually paid — a supplier invoice, a customer payment, a debt repayment, or a straight expense category. Short payments record as partial, and fully-paid invoices drop out of the list.

Match to supplier invoices, customer payments, debts or expense categories
Partial payments recorded properly, not rounded away
Filter by account, category, supplier or reconciled state
Recurring monthly expenses like rent, insurance and internet
Editing a recurring expense asks: correction, or new value from a date?
That date-effective history is why last quarter’s reports stay right after a rent rise
Bank reconciliation and expense matching
Finance
Debt Management

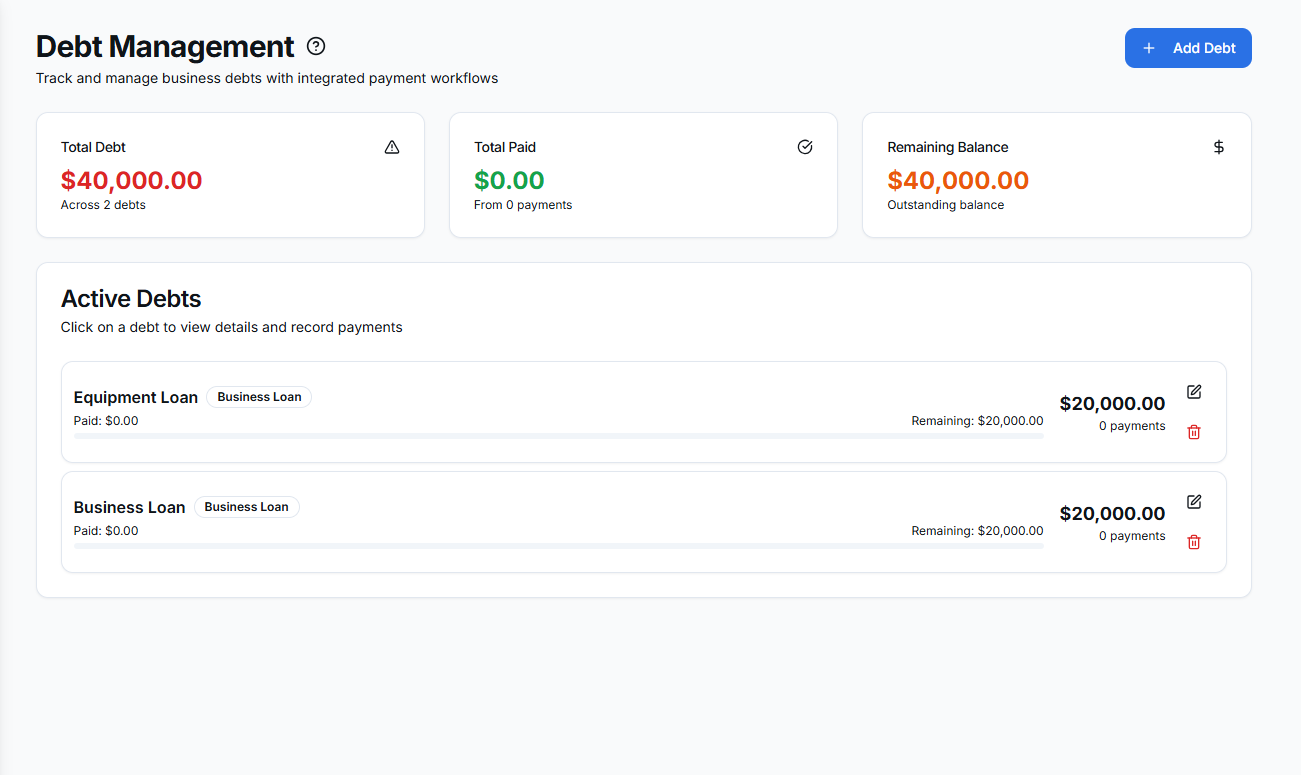
Everything the business owes in one list — ATO, superannuation, equipment finance, loans, trade credit. Super and PAYGW appear here automatically the moment you finalise a pay run, so the bill is visible when it is incurred rather than when it lands.

ATO, super, business loans, equipment finance, credit cards, trade credit
Payments recorded against each debt, optionally linked to a bank transaction
Remaining balance and progress at a glance
Super and PAYGW accrue automatically from finalised pay runs
Debt tracking with repayment progress
Finance
Account Balances

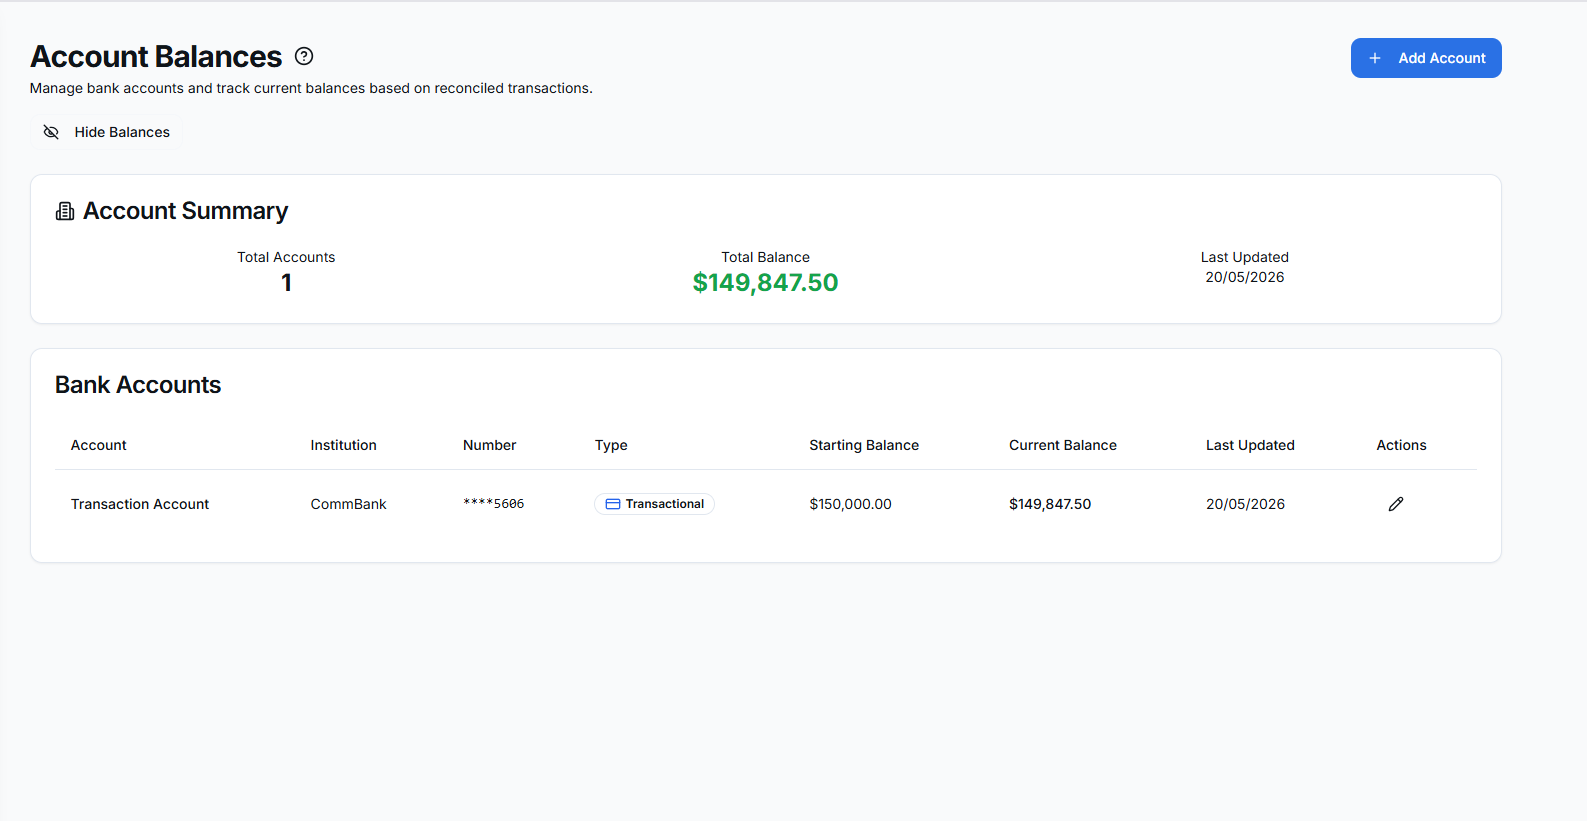
Your bank accounts and credit cards, with balances derived from what you’ve actually reconciled rather than typed in. The total feeds the cash position on your Executive Dashboard.

Transaction, savings and credit card accounts
Current balance derived from reconciled transactions
Choose which accounts count toward break-even
Total cash position rolls into the Executive Dashboard
Account balances across bank and credit accounts

You won't be left
to figure it out.

Getting a café’s numbers set up properly is the part most software leaves you to do alone. This is the part we help with.

Day one
Two fields and you're in
Your rules
Categories, units, break-even
Every page
A help icon that explains it
Light or dark
However you prefer to work
Getting set up
Getting started

You start with your name and your venue’s name. From there the sidebar groups every page by what you’d actually use it for, and you can bring in as much or as little history as you like — one invoice is enough to see how costing works.

Two fields to get started
Sensible default categories, units and expense types created for you
Import as much or as little history as you want
Sample data available if you’d rather explore before committing
SteamStack onboarding screen
Getting set up
Settings

The control panel behind everything else — the categories, units and break-even rules the rest of SteamStack calculates from. Set once, and the reports follow your definitions rather than someone else’s.

Expense and income categories, with a GST-free flag per category
Choose which categories count toward break-even
Set your target food cost percentage
Pick how cost of goods is calculated — ordered, paid, estimated or actual
Units of measure with conversion factors, which power cross-unit price comparison
Recipe and ingredient categories
Settings for categories, units and break-even
Getting set up
Help & Guide

A written guide to every page, searchable, built into the app. Every page title carries a help icon that jumps straight to the section for that page — so the answer is where the question is, not in a support queue.

Full-text search across every section
A help icon on every page, linking to its own guide entry
Filter by area, with a sticky table of contents
Report an issue from inside the app
Light and dark themes, remembered per device
Searchable in-app guide

SteamStack — How Each Stack Links

Every module shares data across the platform. Click any connection line between two stacks to learn exactly how they work together.

SteamStackHow each stack links
Business Insights
  • Executive Dashboard
  • Business Summary
  • Weekly Reports
  • Trackers
Operations
  • Ingredients
  • Recipe Builder
  • Batch Recipes
  • Business Contacts
  • Bills / Purchase Orders
Sales & Customers
  • Sales Analytics
  • Customer Invoices
People & HR
  • Employees
  • Rostering
  • Calendar & Tasks
  • Weekly Payroll
Finance
  • Financial Management
  • Sales
  • Bank Transactions
  • Expenses (Recurring)
  • Debt Management
  • Account Balances
  • Calculator
  • Money Counter

Click any connection line to see how two stacks link together

Connection

Seen enough?

SteamStack is opening up gradually to Australian café and restaurant owners. Register your interest and we’ll be in touch when a place opens.

← Back to home Register your interest →